Numeric Graph Dashboard Cards for Home Assistant
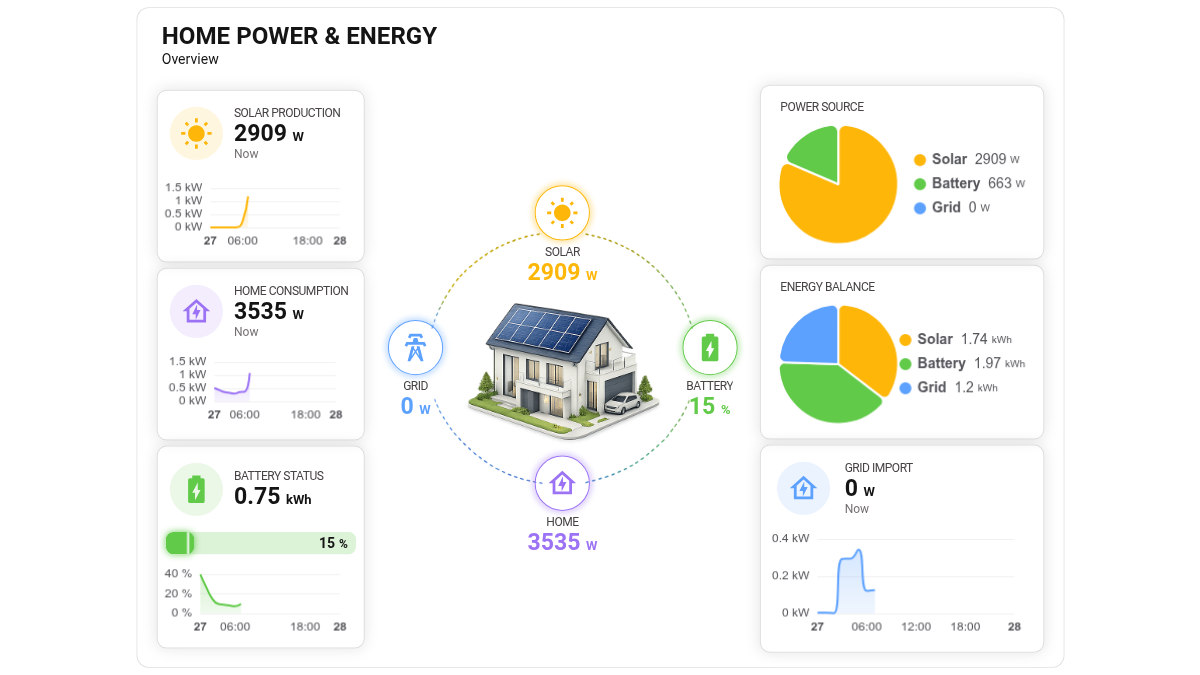
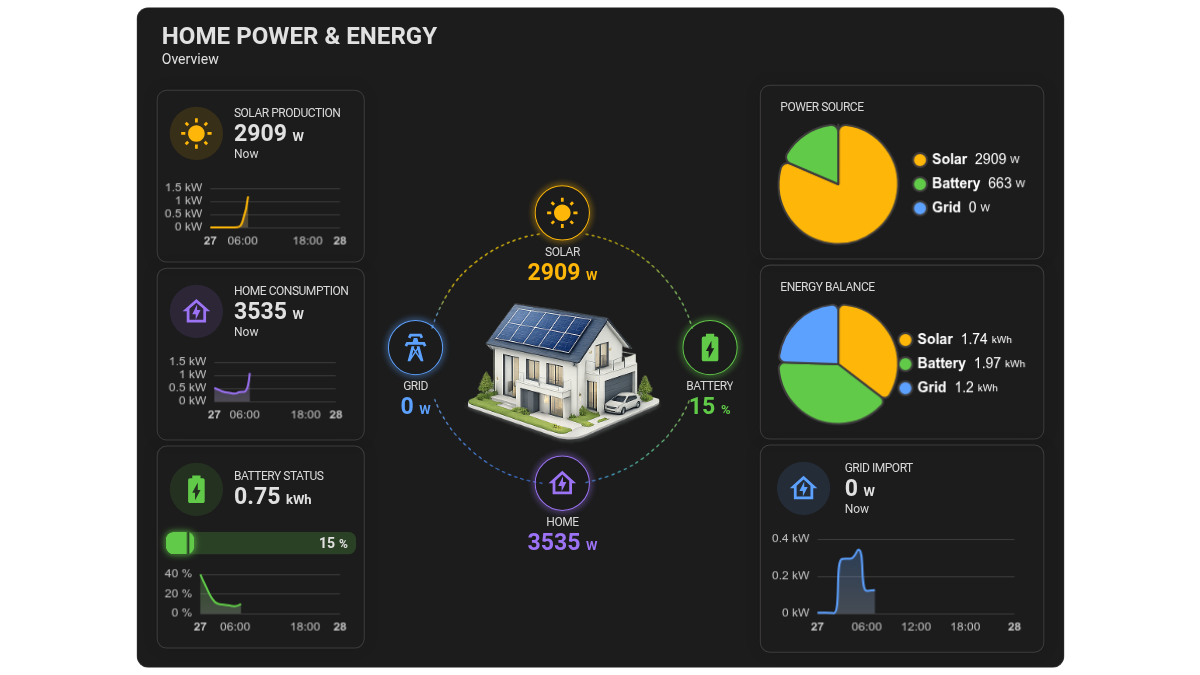
Cards that visualize numeric sensor data through line charts, area plots, or bar graphs directly on your Home Assistant dashboard. These cards allow you to track historical trends, monitor usage statistics, and analyze device performance over specific time intervals. Use this tag to find efficient ways to display analytical sensor data.
Showing 1–1 of 1 cards