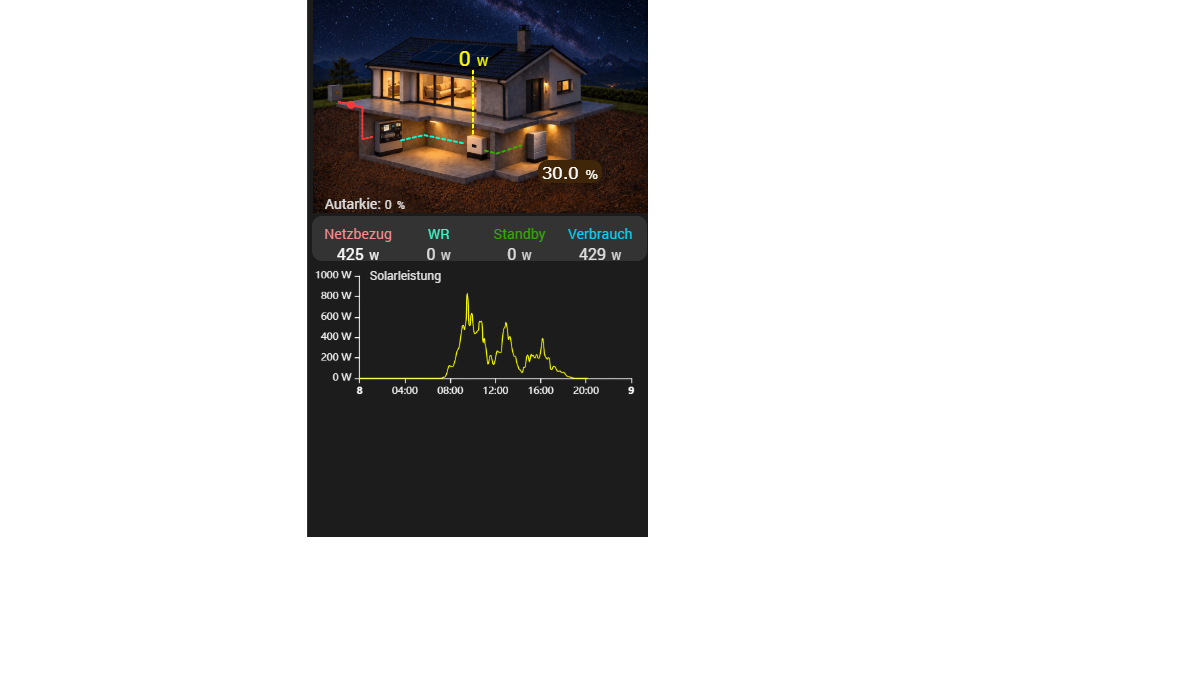
Line Charts Dashboard Cards for Home Assistant
Dashboard cards that display data trends using line charts within Home Assistant. These cards are ideal for visualizing historical sensor data, temperature fluctuations, and energy consumption over time. Use these cards to track entity states and observe patterns through clear graphical representations.
Showing 1–1 of 1 cards