
Energy Management Dashboard Cards for Home Assistant
Showing 1–4 of 4 cards
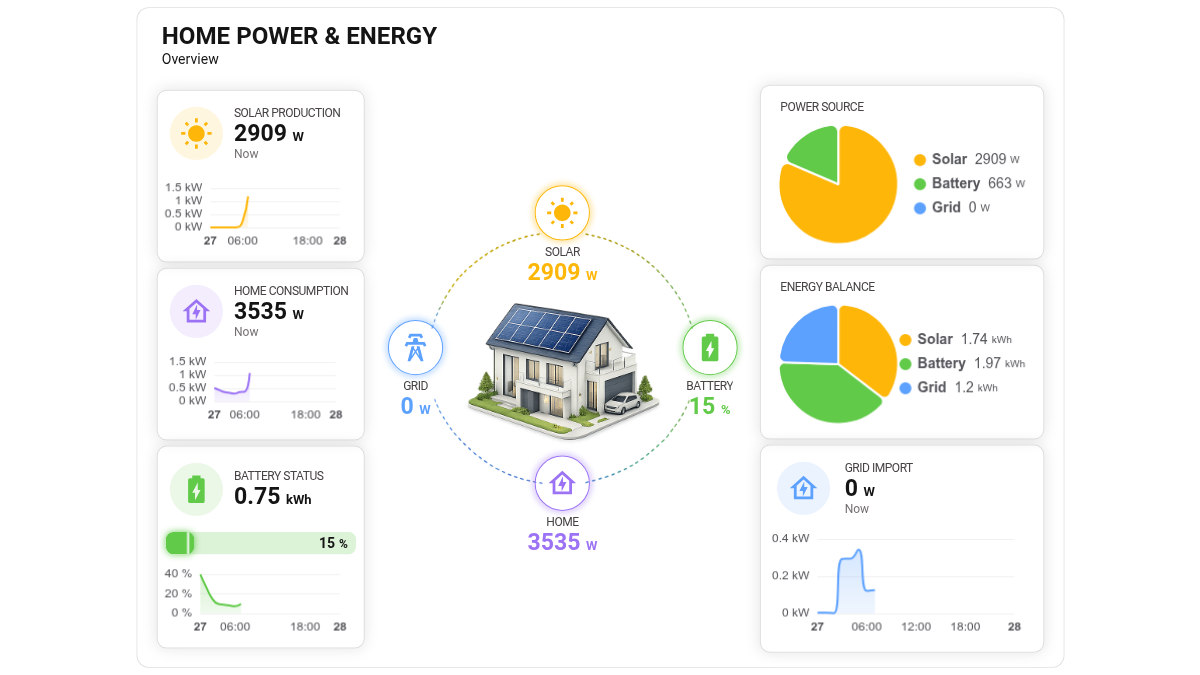
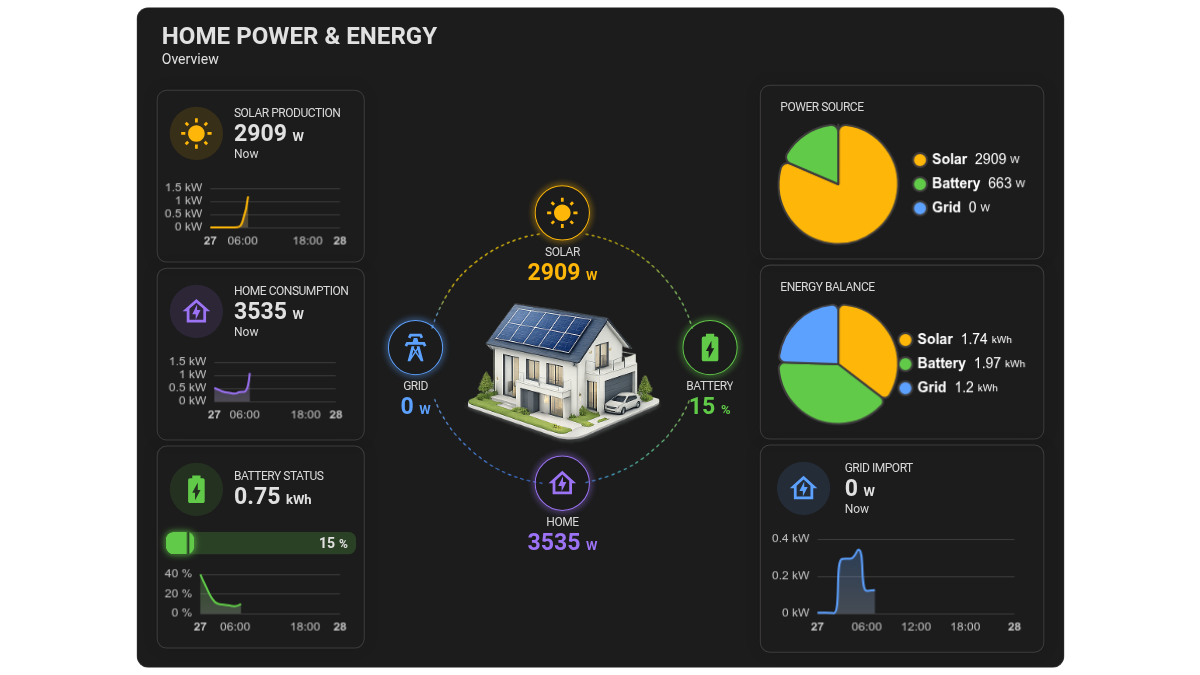
Home Power & Energy Center
A clean and modern Home Assistant energy dashboard card designed to monitor your home power flow at a glance. It displays solar production, home consumption, battery status, grid import, and energy balance in a clear visual layout with charts, gauges, and source breakdowns. Ideal for photovoltaic systems, battery storage setups, and smart homes, this card helps you understand how energy is produced, consumed, stored, and imported from the grid in real time. The balanced design makes it suitable for both daily monitoring and advanced energy dashboards
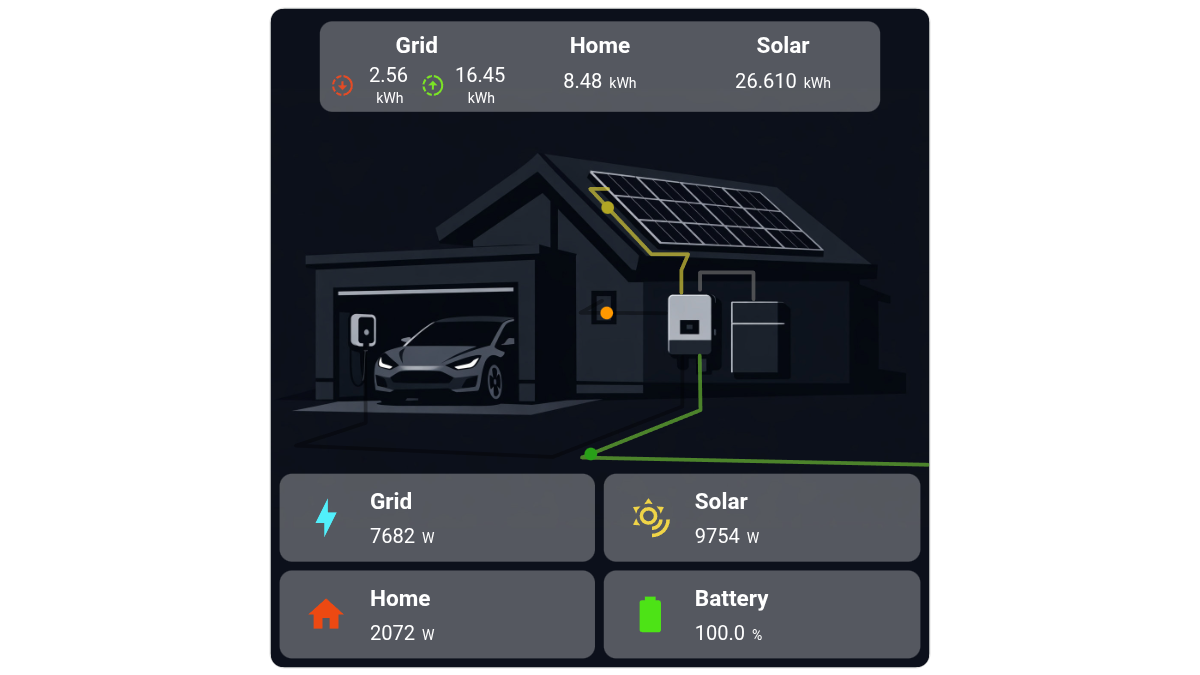
House Energy Flow with Background
This Home Assistant card provides a visual overview of energy flow within a residential system, including grid, solar production, home consumption, and battery status. At the center, a schematic illustration of the house shows the energy paths between components (solar panels, inverter, battery, grid, and home). Along these paths, animated dots represent the real-time flow of energy. The speed of these animations dynamically changes based on the value of the associated entity, giving immediate visual feedback on the intensity of the energy transfer. At the top, a summary bar displays cumulative energy values (in kWh) for Grid, Home, and Solar. At the bottom, four dedicated sections present real-time power and status: Grid: current power exchange with the grid (W) Solar: current solar production (W) Home: current household consumption (W) Battery: current charge level (%) Each section is paired with an icon and clearly labeled value for quick readability. The overall layout combines numerical data with animated visual cues to make energy distribution and usage easy to understand at a glance.
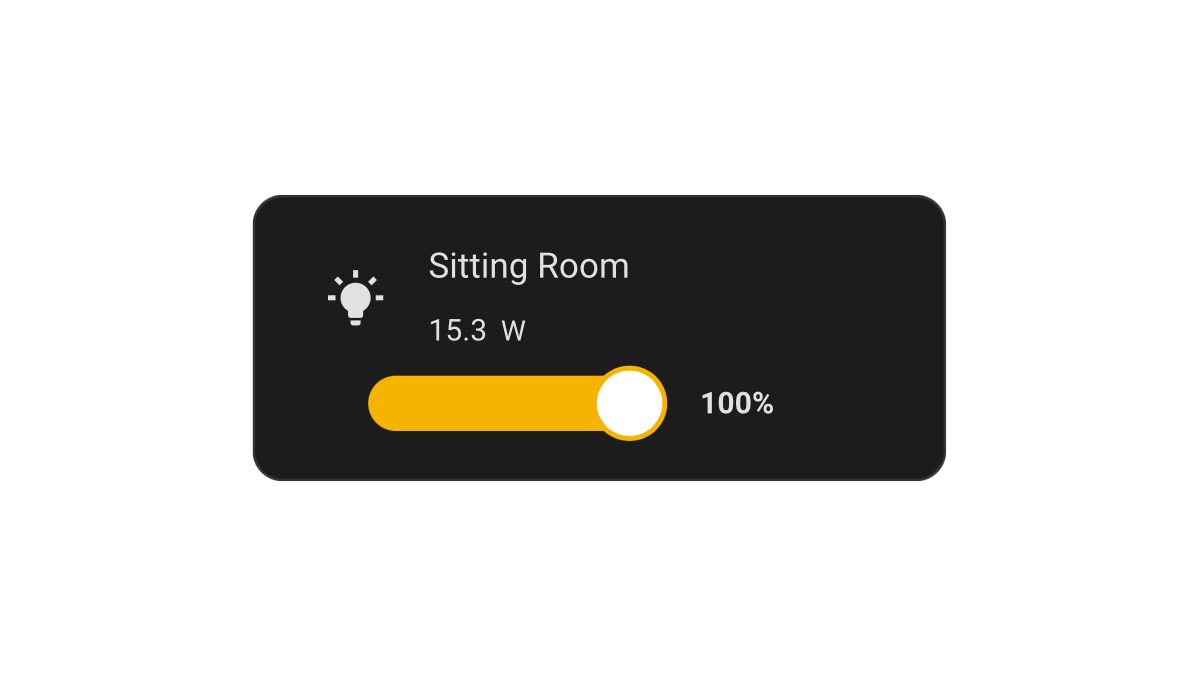
Light Dimmer Power Sensor
A light dimmer card controlling a light entity and additionally displays the value of a different entity that might correspond to a power sensor for the light entity. The card includes a changing icon on-off light entity toggle and a light dimmer slider. Clicking on the light entity description opens the light sensor more info and on the displayed level of the power sensor a more info pop-up for the sensor.
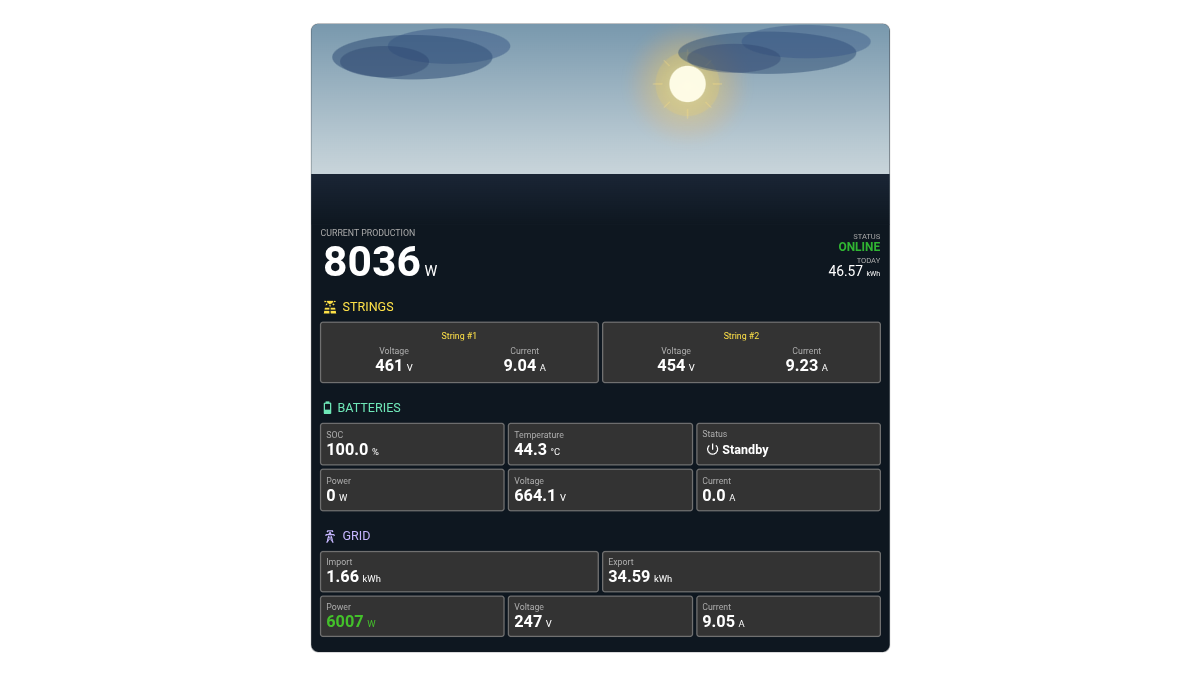
Photovoltaic Monitor for 2 Strings, Batteries, 1 Phase Grid and Animated Background
A modern and informative Home Assistant dashboard card designed to monitor a photovoltaic system with 2 solar strings, battery storage, and a single-phase grid connection. The card provides a clear overview of real-time solar production, battery status, and grid import/export data, helping you track your energy flow at a glance. The top section features a dynamic animated background that changes according to current weather conditions and the real-time position of the sun, creating a more immersive and visually engaging monitoring experience throughout the day.
Home Power & Energy Center
A clean and modern Home Assistant energy dashboard card designed to monitor your home power flow at a glance. It displays solar production, home consumption, battery status, grid import, and energy balance in a clear visual layout with charts, gauges, and source breakdowns. Ideal for photovoltaic systems, battery storage setups, and smart homes, this card helps you understand how energy is produced, consumed, stored, and imported from the grid in real time. The balanced design makes it suitable for both daily monitoring and advanced energy dashboards
House Energy Flow with Background
This Home Assistant card provides a visual overview of energy flow within a residential system, including grid, solar production, home consumption, and battery status. At the center, a schematic illustration of the house shows the energy paths between components (solar panels, inverter, battery, grid, and home). Along these paths, animated dots represent the real-time flow of energy. The speed of these animations dynamically changes based on the value of the associated entity, giving immediate visual feedback on the intensity of the energy transfer. At the top, a summary bar displays cumulative energy values (in kWh) for Grid, Home, and Solar. At the bottom, four dedicated sections present real-time power and status: Grid: current power exchange with the grid (W) Solar: current solar production (W) Home: current household consumption (W) Battery: current charge level (%) Each section is paired with an icon and clearly labeled value for quick readability. The overall layout combines numerical data with animated visual cues to make energy distribution and usage easy to understand at a glance.
Light Dimmer Power Sensor
A light dimmer card controlling a light entity and additionally displays the value of a different entity that might correspond to a power sensor for the light entity. The card includes a changing icon on-off light entity toggle and a light dimmer slider. Clicking on the light entity description opens the light sensor more info and on the displayed level of the power sensor a more info pop-up for the sensor.
Photovoltaic Monitor for 2 Strings, Batteries, 1 Phase Grid and Animated Background
A modern and informative Home Assistant dashboard card designed to monitor a photovoltaic system with 2 solar strings, battery storage, and a single-phase grid connection. The card provides a clear overview of real-time solar production, battery status, and grid import/export data, helping you track your energy flow at a glance. The top section features a dynamic animated background that changes according to current weather conditions and the real-time position of the sun, creating a more immersive and visually engaging monitoring experience throughout the day.